
On NASA's readiness scale, the Space Shuttle is a 9 out of 9. Good luck buying one.
A Technology Readiness Level (TRL) tells you a technology works. It cannot tell you whether you can buy it, whether it is winning, or whether it was retired years ago.
The Disruption Readiness Level (DRL) does. One scale, from the laboratory to the history books.
- Version
- 1.0
- Published
- 2026
- License
- CC BY 4.0
- Publisher
- NavigateX
- Downloads
- Download the PDFs
Space Shuttle Discovery, Steven F. Udvar-Hazy Center. Photo: Smithsonian National Air and Space Museum (CC0)
On this page
Where is this technology in its life?
Ask it before you buy a fleet, build a plant, write a policy, or place a bet. A technology that works in a lab is not one you can deploy this year. A technology everyone already owns is not where the next decade of value sits. A technology on its way out is a stranded asset with a brochure. The entire game is knowing which of these you are looking at, and most expensive strategic mistakes come from reading it wrong.
For sixty years the best answer to part of that question has been NASA's Technology Readiness Level. TRL is one of the most useful ideas in the history of technology management: a clean nine-step ladder from a bright idea (TRL 1) to a system proven in operation (TRL 9). Engineers, funders, defense departments, and governments all speak it, and they speak it because it works.
TRL got us halfway, and halfway is no longer enough.
TRL was built for one job, and it does that job and stops. It measures the climb from invention to a first proven product. At TRL 9 the development race is won and the scale ends.
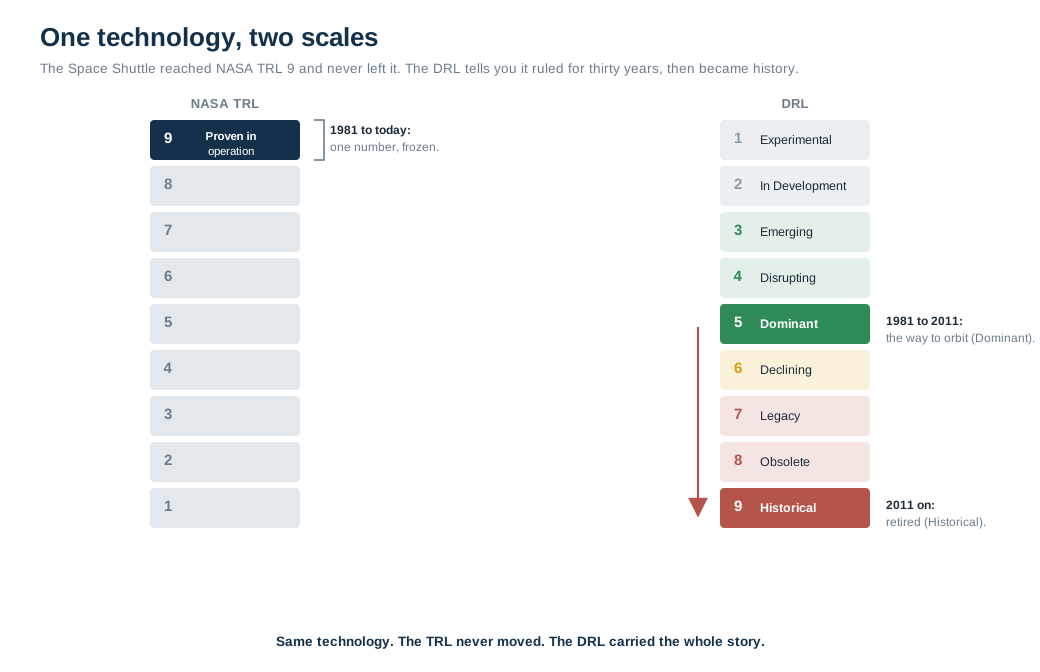
The Space Shuttle in the headline above is the problem in one image. Flight proven across 135 missions, and there is no level higher. TRL 9 tells you a technology has been proven in operation. It tells you nothing about whether you can actually acquire it, whether it is the cheapest option, whether it is the incumbent everyone runs, or whether it was retired years ago and now sits in a museum. The Shuttle has been a TRL 9 system since 1981 and remains one to this day, museum exhibit and all. The rating never changed, because it was never meant to capture any of that.
That is the gap. A TRL of 9 is silent on the entire second half of a technology's life: whether it is available at scale, whether it is winning or losing, and whether it is alive at all. Recommending a TRL 2 technology to someone who needs to deploy this year is a mistake. So is modeling a retired technology as a live purchase. Both come from the same blind spot, and TRL has no way to see either.
That blind spot used to be survivable. Technologies once faded out over comfortable decades, and a scale that ended at "proven" was good enough because the years after were slow and predictable. They are not anymore. We are living through an era where technologies do not retire gracefully. They get disrupted: a challenger crosses them on cost and capability, and the incumbent collapses far faster than anyone plans for. Solar, batteries, and electric vehicles are not coasting downhill, they are flipping markets out from under the incumbents. A maturity scale for this era has to describe the whole arc, including the fall, and it has to understand that the fall is a cliff, not a slope.
That is what the Disruption Readiness Level does.
One reading, from first principle to final retirement.
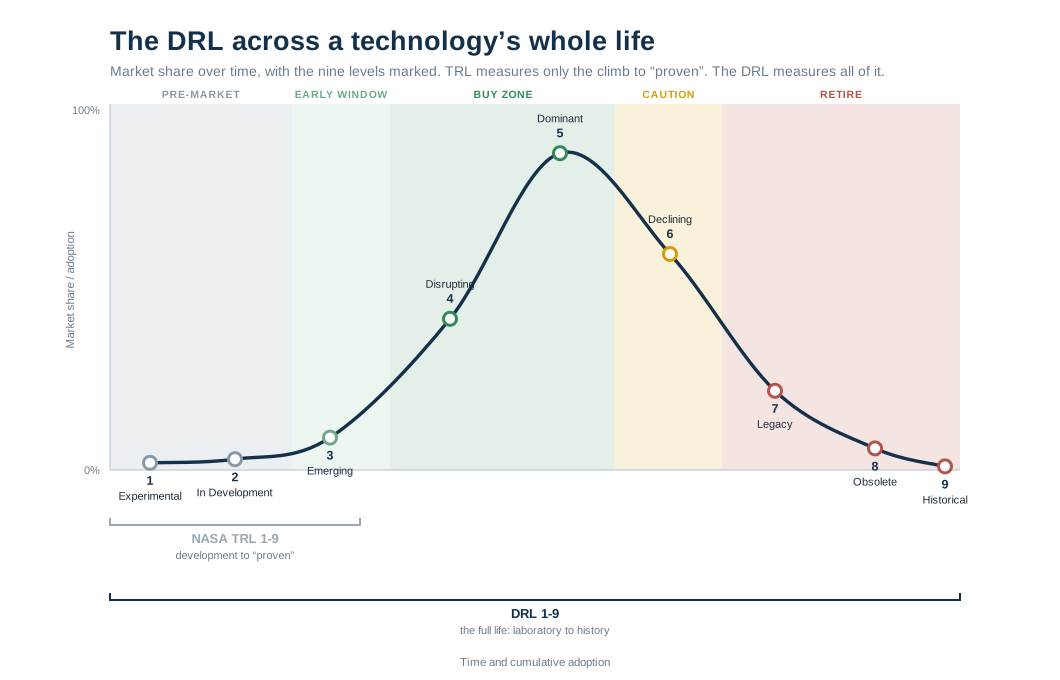
The DRL is a single ordered scale, DRL 1 to DRL 9, for where a technology sits across its entire life, from the laboratory to the history books. It picks up exactly where TRL leaves off and carries the story all the way through: emerging, disrupting, dominant, declining, and gone.
It is built on the economics of disruption rather than the assumption of a gentle product life cycle, and that is the difference that matters. The front of the scale tracks technical maturity, the same ground TRL covers. The back of the scale tracks market position, judged the way disruptions actually run: by where a technology's cost and capability stand against whatever it competes with. Joined end to end, the two halves give one continuous reading from first principle to final retirement.
Nine levels, five decisions.
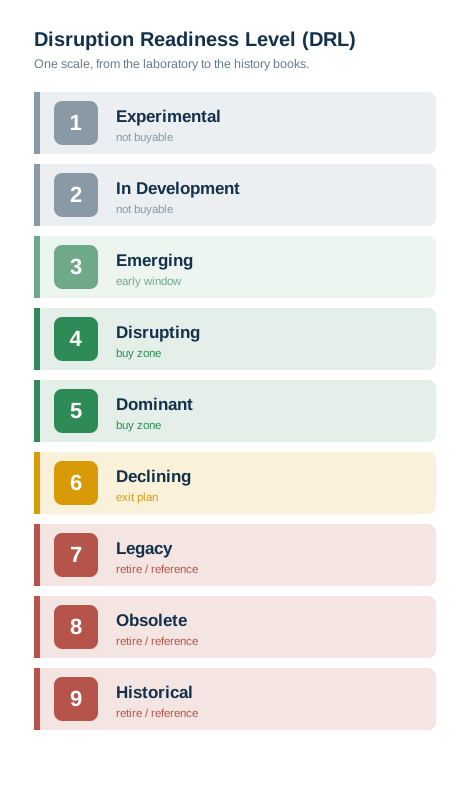
The levels collapse into simple guidance. Levels 1 and 2 are not yet buyable. Level 3 is buyable but unproven: a bet on a crossing that has not happened yet, and many technologies never make it past this point. Levels 4 and 5 are where confident purchases belong. Level 6 is a buy only with an exit plan. Levels 7 and up are replacement and reference, not new build.
Those are the five decision bands. The ladder figure carries the same five, in the same colors.
- Pre-market DRL 1 to 2
- Early window DRL 3
- Buy zone DRL 4 to 5
- Caution DRL 6
- Retire DRL 7 to 9
| DRL | Level | What it means | What it tells a decision-maker |
|---|---|---|---|
| 1 | ExperimentalPre-market | Science and lab work. The open question is whether it is even possible. | Watch. Not buyable. |
| 2 | In DevelopmentPre-market | Engineering and scaling toward a sellable product. Can it be built and supplied at quality? | Track its readiness. Still not buyable. |
| 3 | EmergingEarly window | Commercially available but before the tipping point: niche, not yet cost-competitive at scale. | Buyable now with a forward-looking case. Risky early-mover window. |
| 4 | DisruptingBuy zone | Cost and capability have crossed the incumbent. Adoption is accelerating through the knee of the curve. | Usually the smart buy. The shift is underway. |
| 5 | DominantBuy zone | The winner and current incumbent. The mainstream default, adoption near saturation. | The safe, conventional choice. |
| 6 | DecliningCaution | A newer technology has crossed it. It is losing share, and the decline compounds. | Buy only with eyes open and an exit plan. |
| 7 | LegacyRetire | Displaced from new-build decisions. The installed base lives on, and a replacement market can persist for years to keep existing capability alive. | Do not build new on it. Replacement demand only. |
| 8 | ObsoleteRetire | No longer sold or supported, but only recently so. | Plan your exit. Reference only. |
| 9 | HistoricalRetire | Out of the active market entirely. Kept as a case study. | For learning, not for buying. |
The names are deliberately plain. A level should describe what a technology is, not the jargon around it. And the scale is a wheel as much as a line: every Dominant technology was once a Disruptor that won, and most will one day be disrupted in turn. Today's level 5 is tomorrow's level 6. The Space Shuttle that opened this page would read DRL 9 today; for thirty years before that it would have read DRL 5, the dominant way for the United States to fly people to orbit. TRL had one number for all of it. The DRL has the whole story.
The transitions are the useful part.
The transitions are the useful part, because the most important of them are not opinions. They are points on a cost curve.
Engineering milestones levels 1 to 3
The early steps are engineering milestones. A technology becomes In Development when a working proof of concept exists, and Emerging when you can first actually place an order, however niche or expensive.
Market crossings levels 3 to 6
The market steps are driven by cost and capability, exactly as the Seba Technology Disruption Framework describes. Emerging becomes Disrupting when a technology crosses the competitive threshold against the incumbent and adoption turns sharply up, the moment disruption researchers call the knee of the curve. Disrupting becomes Dominant when it holds the majority of new deployment. Dominant becomes Declining when a newer challenger crosses the threshold against it, and the loss of share begins to compound, because the same feedback loops that lifted the winner now run in reverse for the loser. None of this requires a forecast about the future. It requires an honest reading of where the cost curves already sit.
Retirements levels 6 to 9
The late steps are retirements. Declining becomes Legacy when a technology drops out of new-build decisions but its installed base must still be maintained. Legacy becomes Obsolete when sale and support end, and Obsolete becomes Historical when it leaves active use altogether.
The DRL does not replace the models you use. It spans them.
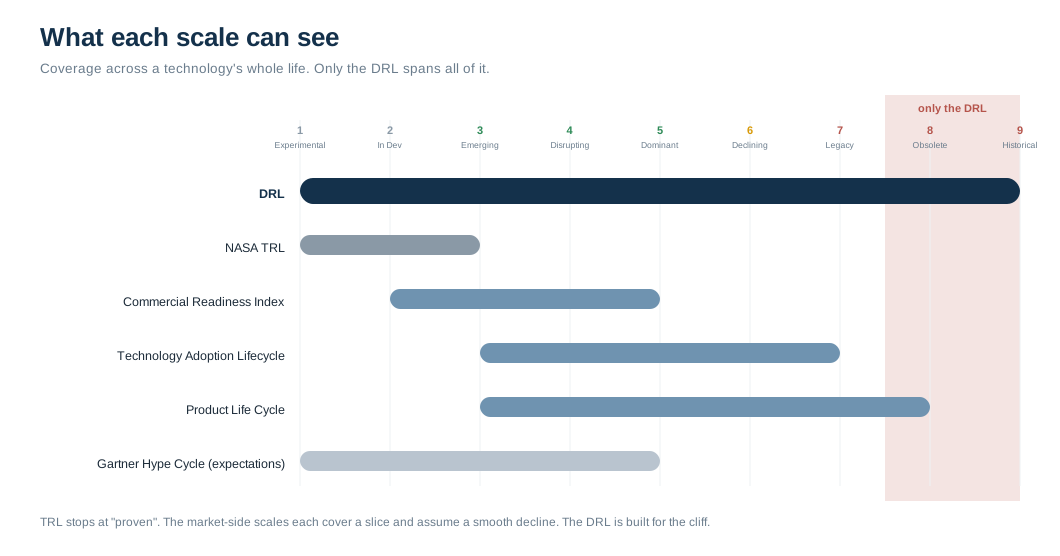
The DRL does not throw away the existing models. It is one scale that spans what several partial ones each describe, and it maps cleanly to all of them. This is the crosswalk for anyone who already thinks in TRL, commercial readiness, adoption curves, or product life cycles.
| DRL level | NASA TRL | Commercial Readiness Index | Adoption (Rogers / Moore) | Product Life Cycle | Gartner Hype Cycle |
|---|---|---|---|---|---|
| Experimental | 1-4 | n/a | n/a | n/a | Innovation Trigger |
| In Development | 5-9 | 1-2 | n/a | n/a | Peak / Trough |
| Emerging | 9 | 3 | Innovators, Early Adopters | Introduction | Slope of Enlightenment |
| Disrupting | n/a | 4-5 | Early Majority (crossing the chasm) | Growth | climbing to Plateau |
| Dominant | n/a | 6 | Late Majority | Maturity | Plateau of Productivity |
| Declining | n/a | n/a | Laggards | Decline | n/a |
| Legacy | n/a | n/a | n/a | late Decline | n/a |
| Obsolete | n/a | n/a | n/a | end of life | n/a |
| Historical | n/a | n/a | n/a | n/a | n/a |
Two things stand out in that table. The first is how much of it is empty on the right. TRL covers only the development columns. The Commercial Readiness Index, an excellent scale developed by the Australian Renewable Energy Agency, was built to pick up where TRL stops and is the closest existing fit to the early market half: it runs from a hypothetical commercial proposition up to a bankable asset class. But it tops out at "mature" and has nothing to say about decline. The adoption lifecycle and the product life cycle do reach into decline, and the Hype Cycle captures the mood of the early stages well, but the Hype Cycle describes expectations rather than deployment, so its mapping is the loosest.
The second is that every one of these models, where it does describe market life, assumes a smooth and roughly symmetric rise and fall. That assumption is exactly what disruption breaks, which is why the DRL needed a different spine.
The obvious objection, answered.
The honest question is why not just extend TRL past 9, or simply adopt one of the models above. We worked through both, and neither holds.
TRL cannot be stretched past 9 cleanly, because the moment a technology is proven you stop measuring technical readiness and start measuring market position. Those are two different axes, and bolting one onto the other muddles both. The DRL keeps them as two halves of one scale instead, with the handover at the point of first sale.
The market-side models can be borrowed, but they carry the smooth-curve assumption with them. When a challenger crosses an incumbent on cost and capability, the incumbent does not glide down a symmetric slope. It can begin to fail at a few percent of share lost and collapse inside a single one. A maturity scale built for this era has to treat decline as the cliff it actually is, and it has to know what pushed the technology over the edge. That is the gap the DRL was built to close, and it is why the back half of the scale is framed around disruption rather than around a tidy bell curve.
Technologies do not all march neatly up the scale and back down it.
A scale worth using has to say what happens at the messy edges, and these edges are where the DRL earns its keep.
-
Death in developmentnuclear-powered aircraft
Some technologies never reach the market at all. They are abandoned in development. American programs spent the 1940s and 1950s trying to build a nuclear-powered aircraft, even flying a reactor in a testbed, but the shielding weight was never solved and intercontinental missiles made the mission pointless. The technology peaked in development and was abandoned with no disruptor to blame. The DRL records not just where a technology is now but the highest level it ever reached and the reason it left, so a project that died in the lab is never confused with one that lived a full market life.
-
Too earlyApple Newton
Some reach the market and stall without ever crossing into dominance. The Apple Newton created the personal digital assistant category in 1993 and was too early: the enabling technologies it needed, capable touchscreens, dense batteries, low-power chips, wireless, and a base of mobile apps, had not yet converged. Apple killed it in 1998. The category did not die with it. Palm picked up a leaner version and drove a real boom before the smartphone absorbed the whole category in the late 2000s. "Too early" is one of the most important readings the DRL can give, because it is the convergence thesis in miniature: a technology available at Emerging whose enabling stack has not yet crossed is a likely stall, and a candidate to die before it ever disrupts.
-
The second attempttablet computer
Some technologies come back. A historical idea can return when the conditions finally line up. The tablet computer finished the job the Newton started a decade too early, and the iPad reached Dominant. The DRL treats this as a successor, a new entry with a line drawn back to its predecessor, rather than pretending the original came back to life.
-
Changing jobsSailing
Some change jobs rather than dying. Sailing lost the cargo trade to steam more than a century ago and did not disappear. It moved, and it thrives as sport and recreation, where it is still innovating: the foiling boats that rise out of the water are genuine advances. The DRL handles this by reading a technology in its context. Sailing-as-transport is Historical, with steam as the disruptor. Sailing-as-sport is a living entry with its own arc. The technology does not loop back up its old curve. It gets a new curve in a new context.
-
Legacy is not deadfax machines
And Legacy is not a synonym for dead. A displaced technology can support a real replacement market for decades while its installed base is kept alive. Governments were still buying new fax machines long after the fax lost the office, and the FAA ran its radar and flight-control systems on 1960s germanium transistors long after silicon won, because the capability had to be maintained until a full process change could retire it. Legacy demand is replacement demand, and the DRL marks it as exactly that: real, but not new-build.
Nine technologies, read on the scale.
The values below are illustrative, meant to show how the scale reads real technologies rather than to settle any single case. They are the fastest way to feel what the DRL captures that a single readiness number cannot.
| Technology | DRL today | Peak DRL | What it shows |
|---|---|---|---|
| Solar PV | Disrupting (globally) | Disrupting | The textbook live disruption, already Dominant in some markets |
| Electric vehicles | Disrupting | Disrupting | Crossing the incumbent on cost in market after market |
| Internal combustion vehicles | Declining | Dominant | A century at Dominant, now on the cliff as EVs cross |
| Personal digital assistant | Historical | Disrupting | A category with a premature first product (Newton), absorbed by the smartphone |
| Tablet computer | Dominant | Dominant | The successor that delivered the Newton's original promise |
| Fax machine | Legacy | Dominant | Displaced, but a replacement market lived on for decades |
| Space Shuttle | Historical | Dominant | TRL 9 throughout, yet never buyable and now retired |
| Nuclear-powered aircraft | Historical | In Development | Death before market, with no disruptor to blame |
| Sailing (as sport) | Dominant | Dominant | A technology that changed jobs and kept innovating |
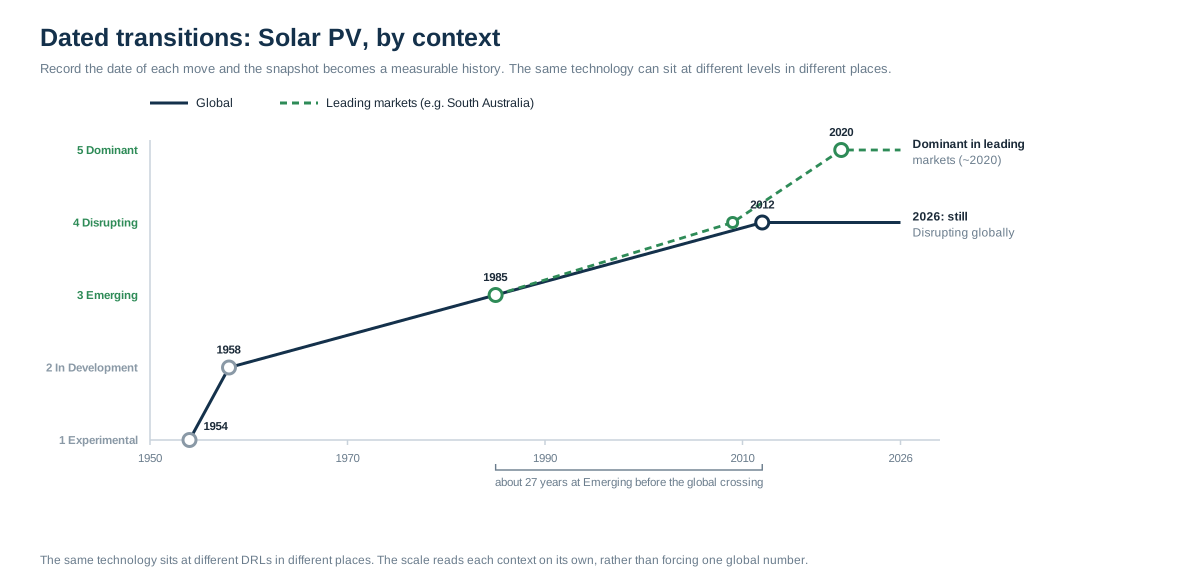
The same technology is not at the same level everywhere.
Solar PV is Disrupting globally and already Dominant in leading markets like South Australia, at the same moment. That is not a contradiction. The DRL reads a technology in its context, so a global view and a regional one can both be true and both be useful.
There is one more thing the DRL unlocks once you start using it, and it matters for the whole field. A level on its own is a snapshot. Record the date each time a technology changes level and the snapshot becomes a history, and a history can be measured.
- How long does a technology really sit at Emerging before it crosses?
- How fast is the run from Disrupting to Dominant once the knee arrives?
- How quickly does a disrupted incumbent fall from Dominant to Legacy?
These are the questions disruption research most wants answered, and they are exactly the questions a body of dated DRL histories can answer from real examples rather than guesswork. Year level precision is usually enough, and often all the historical record offers.
We are honest about the limit here. The underlying science, the Seba Technology Disruption Framework, is explicit that no model yet predicts the exact timing of the inflection point or the ultimate size of a market. The DRL inherits that limit. It will not hand anyone a formula for when the knee arrives. What it will build, technology by technology and date by date, is a growing base of comparable timings to reason from, which is the next best thing and something the field has never had in one place.
Four readers, four uses.
The DRL is meant to be useful to anyone who has to act on where a technology stands, not only to the people who build technologies.
A buyer or operator uses it to avoid the two classic mistakes: paying for something not yet ready, and building new capability on something already dying.
An investor or strategist uses it to read position rather than hype. A technology at Disrupting with the cost curves behind it is a different proposition from one stuck at Emerging while its enabling technologies have not converged, even when the press treats them the same.
A policymaker or planner uses it to time support and avoid stranding public money in a technology about to be crossed.
And anyone tracking a sector over time can date each move between levels and start to see how fast the disruptions in their own field actually run.
What we have not nailed down.
A living standard should be honest about what it has not yet nailed down, and the DRL has two open edges worth naming, because progress on them is an invitation to contribute rather than a flaw to hide.
The first is the stable niche. Some technologies do not die so much as find a small, durable floor and sit on it for a very long time. In the data, a durable floor and a slow fade can look alike for years, and telling them apart in the moment is a judgment that dated histories will sharpen but not fully settle.
The second is timing, the limit already named above: detecting that a cost-capability crossover has happened is firm ground, while forecasting exactly when adoption velocity will turn is not. The DRL is designed to carry that uncertainty openly rather than to paper over it with false precision.
On the shoulders of two ideas.
The DRL stands on two ideas. It keeps the spirit of NASA's Technology Readiness Level, the clean nine-step scale that taught a generation how to talk about maturity. And it extends the Seba Technology Disruption Framework, the body of work by Tony Seba and the RethinkX team that explains why disruptions follow cost curves and S-curves and why incumbents fall the way they do. The DRL is, in effect, the maturity scale that the disruption thesis implies. TRL told you whether a technology works. The DRL tells you where it stands in a world that disrupts.
NavigateX developed the DRL and stewards it as an open reference. We want it used, cited, and improved, because a shared vocabulary for technology maturity is worth more to everyone, us included, than a proprietary one. To make that concrete, the DRL is published under a Creative Commons Attribution 4.0 International license (CC BY 4.0): free to share and adapt, including commercially, with attribution to NavigateX. The NavigateX and Janus names and marks are not covered by that license and remain ours, so you can build on the scale freely without implying we endorsed the result.
NavigateX, Disruption Readiness Level (DRL), version 1.0, 2026. navigatex.tech/drl
A standard improves by being used.
Corrections, worked examples, and DRL readings for technologies we have not covered are all welcome at drl@navigatex.tech. We read everything. Where a contribution changes the standard we will say so and credit it.
Dated transitions are the most useful thing you can send: when a technology moved between levels in your market, and what you based the call on. A body of dated histories, gathered from people working in their own fields, is the thing this field has never had in one place, and it is the only way the timing questions get answered from evidence rather than guesswork.
Substantive changes to the levels, the transition criteria, or the decision bands are published as a new numbered version of the standard, with the previous version kept available.
Everything above, in two portable formats. Nothing in them that is not on this page.
Direct links. No form, no email. Both are licensed CC BY 4.0.
We also put it to work. Inside Janus by NavigateX, our disruption-modeling platform, the DRL is the maturity layer that decides which technologies belong in a recommendation and which do not, kept honest by the same cost curves that drive the rest of the analysis. If you want to see your own portfolio or capital plan read against it, that is what Janus does. But you do not need us to use the DRL. The scale is yours to pick up.
An open reference from NavigateX, licensed under CC BY 4.0. Reuse permitted with attribution.
The Disruption Readiness Level (DRL) is published by NavigateX as an open reference, licensed under Creative Commons Attribution 4.0 International (CC BY 4.0). You are free to share and adapt it, including commercially, with attribution to NavigateX. The NavigateX and Janus names and marks are not licensed under CC BY and remain the property of NavigateX.
License: creativecommons.org/licenses/by/4.0
Hero photograph: Space Shuttle Discovery (OV-103) in the James S. McDonnell Space Hangar, Steven F. Udvar-Hazy Center. Smithsonian National Air and Space Museum, NASM2013-02525, Open Access (CC0).
NavigateX, Disruption Readiness Level (DRL), version 1.0, 2026. navigatex.tech/drl
DRL Cheat Sheet (PDF) · DRL Reference (PDF)